| 加工定制:是 | 品牌:GE/通用电气 | 型号:PCAN-Diag 2 |
| 测量范围:0-100000 | 尺寸:110*200*70mm | 电池种类:5 |
| 测量精度:0.001 | 电源电压:12V | 用途:can测试仪 |
| 规格:can检测仪 |
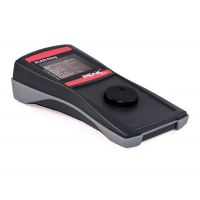
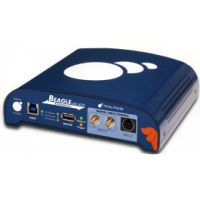
PCAN-Diag2 CAN总线诊断仪是一款具有多种功能的手持式CAN诊断工具,它能够检测CAN总线,如CAN总线的传输速率(比特率)检测,总线负载测量和终端测量。 也可以接收CAN报文,它可以传输单个报文或它们的整个序列。 另外,内部存储卡可以示踪和回放CAN通讯。
PCAN-诊断仪内置的2通道示波器可显示CAN信号。单个CAN ID和各种事件可用于触发。从模拟信号解码CAN帧,例如,探测帧内的错误。
接收到的CAN报文可以用符号显示,更清晰和轻松分配。通过产品附带的 PCAN Symbol Editor 符号编辑软件可轻松生成符号文件。

OLED彩色显示屏可在强烈的环境光线下清晰显示。用户可用一个旋钮选择和操作单个诊断功能。可替换高速CAN,CAN收发器模块可以根据需要与低速或单线CAN连接。
规格
高速CAN( *** 11898-2),CAN收发器模块可根据需要换成低速CAN(*** 11898-3)或者单线CAN(SAE J2411)
CAN连接是9针的D-Sub
可选择固定的或8个用户自定义的比特率
OLED显示屏:320x240像素分辨率
电池(4节1.5V AA)供电或者使用附带的电源适配器(适配器上有低电压插座)
在工程中管理设备配置、传送列表、符号文件以及所有记录的数据(截屏和CSV文件)
内置了最小1GB 内存卡用于保存工程。连接PC时也可用于USB大容量存储器
工作温度:0 至 50 °C (32 至 122 °F)
功能概述:
从预设列表或者8个用户定义值中选择比特率
基于一个固定值列表自动探测比特率
可切换只听模式
可切换安静启动功能(在错误比特率下的只听模式)
用符号文件显示接收CAN报文的符号,包括枚举(数值的列表)、多工器、和ID范围。
符号文件可以通过附带的PCAN Symbol Editor符号编辑器软件创建
记录接收的CAN报文到内存卡上
回放示踪文件
通过Windows?软件可把示踪文件转换成各种输出格式
传送单个CAN帧或CAN帧列表
CAN数据十进制、十六进制、或二进制录入。在运行时(runtime)期间改变单个传送报文的数据
测量CAN总线负载,用时间图显示(如果需要,还包含错误帧)
总线负载时间图可以保存为位图截屏
即便系统正在运行,也可测量高速CAN总线的CAN终端
根据所使用的收发器模块,可切换所连接总线的CAN终端
测量CAN接头(D-Sub)上所有引脚的电压
在工程中管理设备配置、传送列表、符号文件以及所有记录的数据(截屏、踪迹、和CSV文件)
在总线离线错误时可选自动回位
PCAN-Diag Editor编辑软件特性(Windows):
方便配置所有可用设备的设置
编译传送列表
每个工程项目配置最多8个比特率
设备配置、传送列表以及相关符号文件可保存在工程中
通过USB连接将工程传送到PCAN-Diag 2的存储卡
关于示踪功能
现在可用固件1.5.0版本示踪CAN报文。为了也能够在高比特率与高速CAN总线负载一起记录,可对设备硬件进行升级,2012年2月发布。如果你想要进一步的信息market@totalphase.cn
示波器功能
示波器含两个独立测量通道,每个通道采样率为20MHz
显示CAN高和CAN低信号,以及两个信号之间的差
通过BNC连接的探头可检测外部信号(频率可达1MHz)
触发可配置为帧开始、帧结束、CAN错误、或者基于它们的CAN ID的单独的CAN帧
可用BNC接头触发外部测量设备
原始CAN帧描述
从记录的信号踪迹中解码CAN帧
用报告功能显示各种属性和解码CAN帧的测量数据
当前显示可保存为位图截屏
存储器深度可设置到64kS
记录的样本数据可存储为CSV文件
扩展的缩放功能
时间测量,分辨率可达50ns
货品清单:
PCAN-Diag 2,塑料壳
配置软件PCAN-Diag Editor
PCAN Symbol Editor 符号编辑软件【详细说明】
转换软件PEAK-Converter for Windows
电池规格(4 x 1.5 V AA)
Micro USB接头电缆
电源适配器
PDF格式说明书
快速使用指引
存放在防震塑料盒内发运
下载
PCAN-Diag 2 package - 包含软件 PCAN-Diag Editor 和 PCAN Symbol Editor、默认工程项目、设备帮助、和文档
PCAN-Diag 2 手册 PDF 格式
PCAN-Diag 2 is a handheld diagnostics unit with a wide range of functions to allow investigation of a CAN bus, such as detection of the CAN bit rate, bus load measurement, and termination measurement. As well as receiving CAN messages, it can transmit either individual messages or entire sequences of them. In addition, the internal memory card allows tracing and playback of the CAN traffic.
The integrated two-channel oscilloscope enables visualization of CAN signals. Single CAN IDs and various events can be used as triggers. The CAN frames are decoded from the analog signal, for example, to detect errors in the frame.
Incoming CAN messages can be displayed as symbols for clear and easy allocation. The PCAN-Symbol Editor software supplied with this product enables convenient creation of the symbol files needed for this feature.
Output is through a color display with OLED technology which allows excellent readability even when there is strong ambient light. The user selects and operates the individual diagnostic functions using a push dial. As an alternative to High-speed CAN, CAN transceiver modules are also available on request for connecting to Low-speed or Single-wire CAN.
High-speed CAN (*** 11898-2), CAN transceiver module available on request for Low-speed CAN (*** 11898-3) or Single-wire CAN (SAE J2411)
CAN connection is D-Sub, 9-pin
Select from fixed and 8 user-defined bit rates
OLED display with 320 x 240 pixel resolution
Power supply via batteries (4 x 1.5 V AA) or using supply unit provided (low-voltage socket on unit)
Management of device configuration, transmit lists, symbol files, and all recorded data (screenshots and CSV files) in projects
Internal memory card (2 GB) for saving projects. Can also be used as a USB mass storage device when connected to a PC
Operating temperature range from 0 to 50 °C (32 to 122 °F)
Overview of functions
Selection of the bit rate from a preset list or from 8 user-defined values
Automatic bit rate detection based on a fixed value list
Switchable listen-only mode
Switchable silent startup function (listen-only mode at wrong bit rate)
Symbolic display of incoming CAN messages using symbol files, taking into account enums (lists of values), multiplexers, and ID ranges
Symbol files can be set up using the software PCAN-Symbol Editor supplied with this product
Recording of incoming CAN messages to the internal memory card
Playback of trace files
Conversion of trace data to various output formats using Windows? software
Transmitting individual CAN frames or CAN frame lists
Decimal, hexadecimal, or binary entering of CAN data. Data change of a single transmission message during runtime.
Measurement of CAN bus load, display by means of a time diagram, switchable display of error frames
Bus-load time diagrams can be saved as Bitmap screenshots
Measurement of CAN termination for High-speed CAN bus, even while the system is running
Switchable CAN termination for the connected bus, depending on the transceiver module used
Voltage measurement for all pins of the CAN connector (D-Sub)
Management of device configuration, transmit lists, symbol files, and all recorded data (screenshots, trace, and CSV files) in projects
Optional auto-reset on bus off error
Features of the software PCAN-Diag Editor for Windows?, supplied with this product:
Convenient configuration of all available device settings
Compilation of transmit lists
Configuration of up to 8 bit rates per project
Device configuration, transmit lists, and associated symbol files can be saved in projects
Projects can be transferred to the memory card of the PCAN-Diag 2 using an USB connection
Note about the trace function
With the firmware 1.4.8 tracing of CAN messages is now possible. In order to record also at a high bit rate together with high CAN bus load, a hardware upgrade is available for devices that had been delivered before February 2012. If you are interested and for further information, please contact info@peak-system.com
Oscilloscope functions
Oscilloscope with two independent measurement channels, each with a maximum sample rate of 20 MHz
Display of the CAN-High and the CAN-Low signals as well as the difference of both signals
Inspection of external signals (with frequencies up to 1 MHz) with a probe via the BNC connection
Trigger configuration to frame start, frame end, CAN errors, or individual CAN frames based on their
CAN ID
External measurement devices can be triggered using the BNC connector
Depiction of raw CAN frames
Decoding of CAN frames from the recorded signal trace
Display of various properties and of measuring data of the decoded CAN frame using the Report function
Current view can be saved as a Bitmap screenshot
Memory depth can be set to up to 64 kSamples
Recorded sample data can be saved as a CSV file
Extensive zoom functions
Time measurement with a resolution of up to 50 ns